60 accounts linked by Account ID to 720 monthly metric rows, 738 interactions, 470 support cases, and 120 actions.
CASE 01 / NORTH STAR
CUSTOMER-RISK ANALYSIS · EXCELFive accounts.
Five accounts.
$2.358M under review.
The five highest-ARR accounts in the modeled High-risk group make up a $2.358M review queue. The workbook shows the source records and calculations behind each account’s next step.
Download workbook ↓Operational problemAccount signals are spread across activity, support, and follow-up records
What I builtA five-account review queue with traceable calculations
Decision this supportsWhich accounts need action now, and which signals need validation?
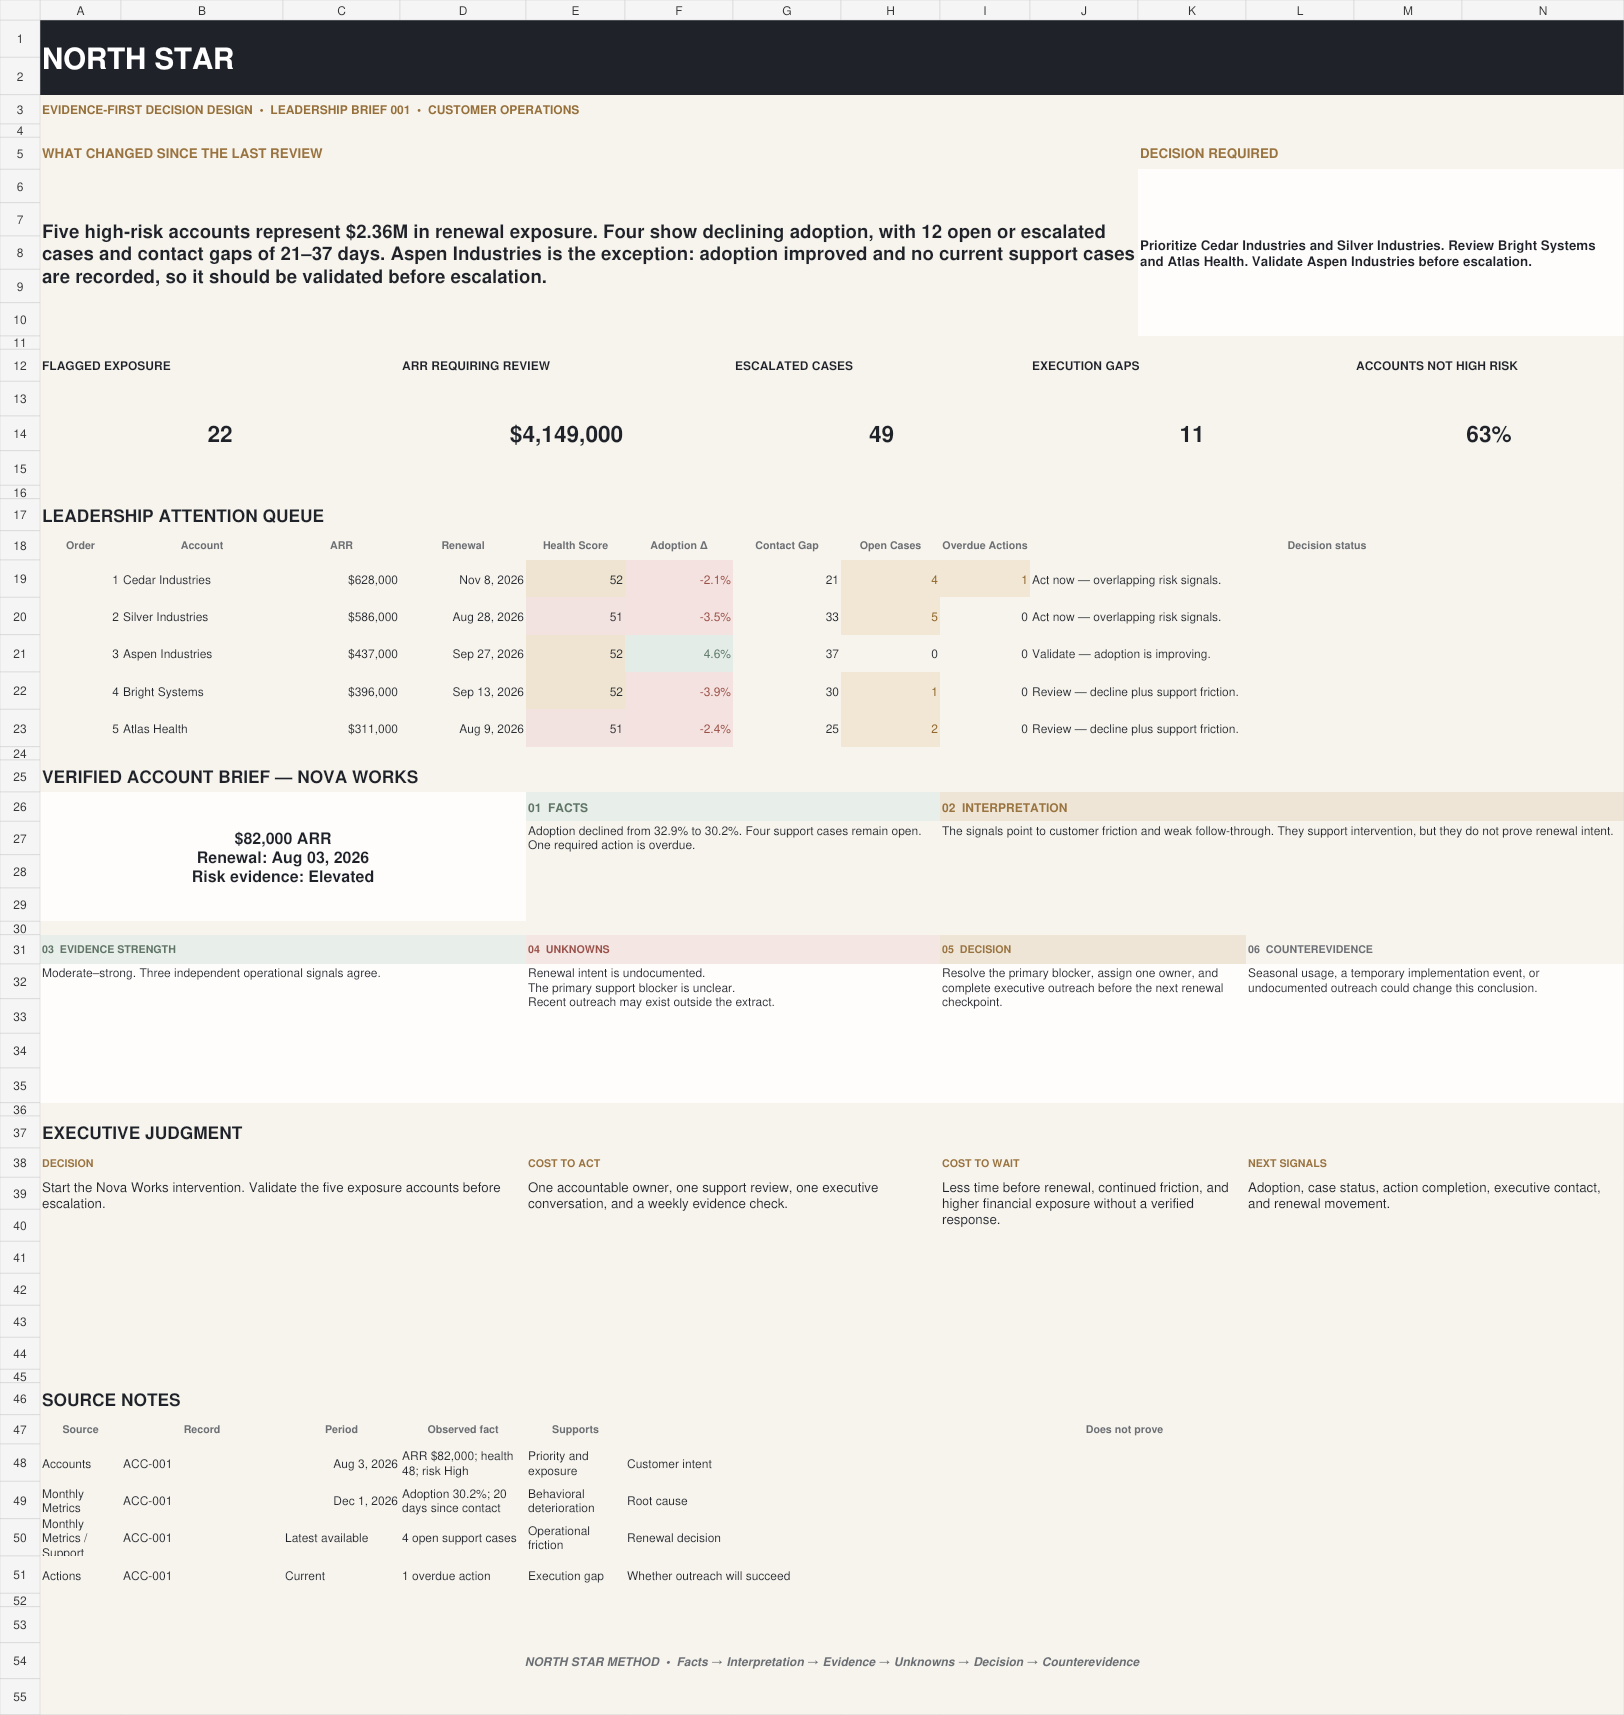 ACTUAL WORKBOOK VIEWSee the five-account queue, review questions, and source notes.Open the full-size sheet ↗
CONNECTION TO MY EXPERIENCE
My work required identifying which changes, discrepancies, and time-sensitive items needed attention first. This fictional workbook applies that same review discipline at the account level; it is not a reconstruction of an employer’s systems, customers, or proprietary data.
LEADERSHIP ATTENTION QUEUE
The table below is a five-account review subset—not the whole high-risk portfolio. It contains the highest-ARR accounts currently labeled High risk.
Swipe horizontally to view all columns.
ACCOUNTARRADOPTION ΔOPEN / ESC.REVIEW
Cedar Industries$628K−2.1 pts4Act now
Silver Industries$586K−3.5 pts5Act now
Aspen Industries$437K+4.6 pts0Validate
Bright Systems$396K−3.9 pts1Review
Atlas Health$311K−2.4 pts2Review
VERIFIED FIVE-ACCOUNT SUBSET$2.358M
Modeled snapshot: December 31, 2025. Adoption Δ compares November with December 2025, shown in percentage points. “Open / Esc.” counts cases whose current status is Open or Escalated. The supplied fictional risk score creates the review group; it does not predict churn or lost revenue.
How the totals reconcileFive-account queue versus the full modeled review group
HOW THE TOTAL RECONCILES
$628K + $586K + $437K + $396K + $311K = $2.358M
WHY OTHER WORKBOOK TOTALS ARE LARGER
The workbook’s $4.149M figure covers all 22 accounts in the modeled High-risk group. The queue above intentionally narrows that population to five accounts for leadership review.
RETENTION GUARDRAIL
Positive signals should not erase unresolved friction.
Recognition, tenure, and activity can all look encouraging. I would still review them beside unresolved issues, repeat exceptions, and declining adoption before treating an account as healthy.
Those signals do not predict churn. They create a practical review queue: where does the relationship look positive on paper, but the operating history still needs attention?
Inspect the Excel workbookActual leadership brief, source tables, and review questions
INSIDE THE WORKBOOK
The leadership brief in Excel.
The opening sheet brings the verified totals, five-account queue, review questions, unknowns, and source records into one review page.
How I built and checked itData structure, formulas, measures, and reconciliation
HOW I BUILT THE REVIEW
Every summary number can be checked.
North Star is a working 12-sheet Excel file, not a set of screenshots. I kept the source data, definitions, calculations, and leadership summary separate so each final number can be checked.
COUNTIF and SUMIF calculate the modeled high-risk count, ARR in that review group, escalated cases, and overdue actions.
The KPI dictionary documents suggested DAX for ARR, weighted forecast, adoption, case status, action completion, and evidence coverage.
The five-account queue totals $2.358M; the full 22-account modeled High-risk group totals $4.149M.
DOWNLOADABLE ARTIFACT
Download workbook ↓The workbook includes the leadership brief, source tables, metric definitions, and reconciliation checks.
Self-directed analysis using fictional B2B SaaS data. The queue contains the five highest-ARR accounts in the modeled High-risk group; the figures demonstrate the method, not client results.